
Problem
Data scattered across systems
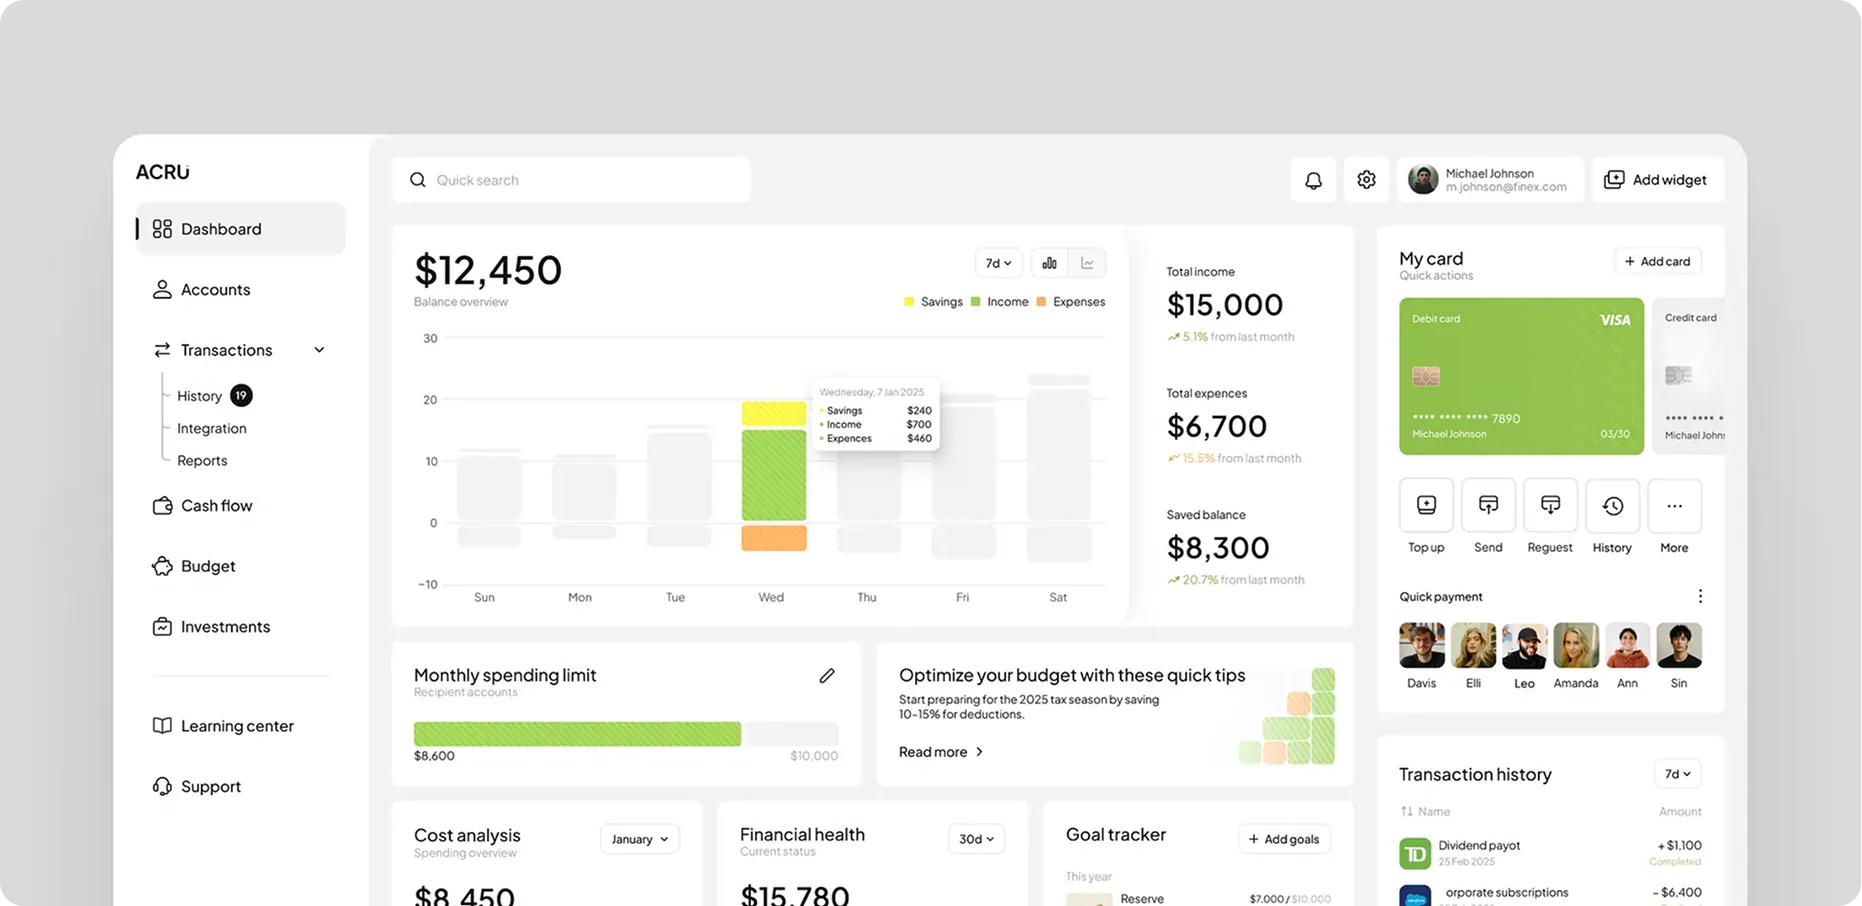
Track dental clinic performance, monitor revenue, measure patient retention, analyze treatment trends and make better decisions with real-time analytics built into Dentobees.
 Portal UI

Every Dentobees module already shows reports for its own work: billing has its numbers, appointments have theirs, recall has its own. That's useful for the person doing the task. But clinic owners and managers need a bigger picture across all of them.
Dentobees Dental Analytics Software brings performance data from across Dentobees into connected dashboards and reports. It helps you track trends, compare results and make decisions without manually combining reports from different modules.
It's the first week of the month. The owner wants to know how revenue compared with last month, which treatments brought it in, and how many patients came back. Billing has one set of figures, the appointment book has another and recall follow-ups are in a spreadsheet. By the time someone pulls everything together, the opportunity to act may already have passed.
The data exists, but it's scattered across different workflows, making it harder to use when it matters.
Nobody has a single view of the clinic.
Someone builds them manually, usually at the end of the day or the end of the month.
Figures are checked in totals, so patterns stay hidden.
Clinics know patients have stopped coming but can't say how many or when.
It's unclear which treatments grow, stall or underperform.
Comparing locations means rebuilding the same report several times.
Hiring, stock, marketing and scheduling are decided by feel.
Problems surface only after they've already cost something.
Dentobees Dental Analytics Software turns everyday clinic activity into clear, actionable insights. Instead of reviewing separate reports from different modules, clinic owners and managers can use connected analytics to understand performance across their practice.
Data scattered across systems
Manual reporting
Limited performance visibility
Difficult retention tracking
Unclear revenue performance
Treatment performance gaps
Multi-clinic complexity
This dental analytics platform is organized around the questions clinic owners and managers actually ask: how much are we earning, who's coming back, which treatments are working, how full are our chairs. Each area below answers one of them.
The day's, week's or month's performance at a glance, so you don't have to open five reports to know how the clinic is doing.
See where revenue comes from and how it's moving. Spot which treatments and providers contribute most, and notice a dip while there's still time to respond.
Understand who's joining, who's staying and who's slipping away. Retention stops being a feeling and becomes a number you can track.
Follow what's recommended, what's accepted and what gets completed. See which procedures are growing and which are slowing down.
Find out where the schedule is leaking. High no-show days, cancellation patterns and underused chairs show up in the data instead of in guesses.
Check whether follow-ups are bringing patients back, and how well reactivation efforts are working.
A clear look at what's been earned, what's been collected and what's still pending.
Compare locations on the same measures, see the whole group in one report and find which branches need attention.
Dentobees Dental Analytics Software brings insights together from different modules, while each module continues to manage its own workflows and daily operations.
Patients are booked, treated, billed and followed up.
Each module records its own work as it goes.
Revenue, retention, appointments and treatments are worked out from those records.
The numbers stay current without manual refresh work.
Dashboards can be turned into reports on demand.
Trends, drops and outliers become visible.
The next step is based on data, not assumption.
See how Dentobees helps your team track performance, spot trends and compare results from one connected platform.
Analytics only matters if it changes what a clinic does next. Here's how better visibility shows up in day-to-day decisions:
One place to see how the clinic is performing.
Hours of manual work replaced by reports that are ready when you need them.
Know where income comes from and where it's slipping.
See patient return rates and act before patients drift.
Invest in what's working and rethink what isn't.
Schedules, staffing and marketing based on real numbers.
One measurement standard for every branch, where supported.
It's the part of Dentobees that brings performance data from across the clinic into dashboards and reports. Owners and managers use it to track revenue, patient retention, treatment trends and appointments without building reports by hand.
Because reports built manually from separate systems are slow, and by the time they're ready, the moment to act has often passed. Dental business intelligence software keeps the numbers current, so decisions are based on what's happening now.
Revenue, patient activity and retention, treatment performance, appointment trends, recall results and financial figures such as collections and outstanding balances. Treatment acceptance and chair utilization are included where supported.
Yes. Revenue can be viewed by trend, treatment, provider and branch, so you can see where income comes from and how it's changing.
Yes. Retention metrics show new, active and returning patients over time, along with follow-up and reactivation results from recall.
Yes. Treatment completion, procedure trends and overall treatment performance can be tracked, with treatment acceptance where supported.
Yes. Appointment volume, no-shows and cancellation trends can be analyzed, with chair utilization where supported.
Yes. Dashboards update as activity is recorded across Dentobees, so what you see reflects current clinic performance.
Branch comparisons, consolidated reporting and regional performance can be viewed in one place. Confirm current availability with the Dentobees team.
Yes. Reports covering revenue, patients, treatments, appointments, recall and financial performance can be generated on demand.
Yes. Analytics reads from Dental Accounting Software and Dental Billing Software, so financial and collections figures reflect what's recorded there. Each module continues to manage its own transactions.
Reports can be exported for sharing or record-keeping. Confirm current formats with the Dentobees team.

Track performance, measure growth, understand patient behavior and improve clinic operations with real-time analytics and reporting from Dentobees.